
Self-serve analytics at scale. Fully traceable.
Fully traceable AI analytics. In a governed, last-mile execution layer.
Ronja sits between your existing stack and your team. A federated context layer reads from your existing tools (dbt, Cube, Confluence) and learns from every interaction. Every answer is traceable. Every pipeline is exportable as dbt. Your team stays in control.
Get started


Six capabilities. One platform.
Ingestion
Connect any data source in minutes
100+ pre-built connectors for files, databases, APIs, and cloud storage. HubSpot, Salesforce, Fortnox, Shopify, Postgres, S3, Google Ads, LinkedIn Ads, GA4, Excel, CSV, and more. Set up in minutes, not weeks.
Data Lake
All your data. One place. Always ready.
Built-in storage for all your data. Already have Snowflake or BigQuery? Ronja layers on top. Queries run on Ronja's execution layer, not your warehouse.
Data Modelling
You set the direction. Agents write the code.
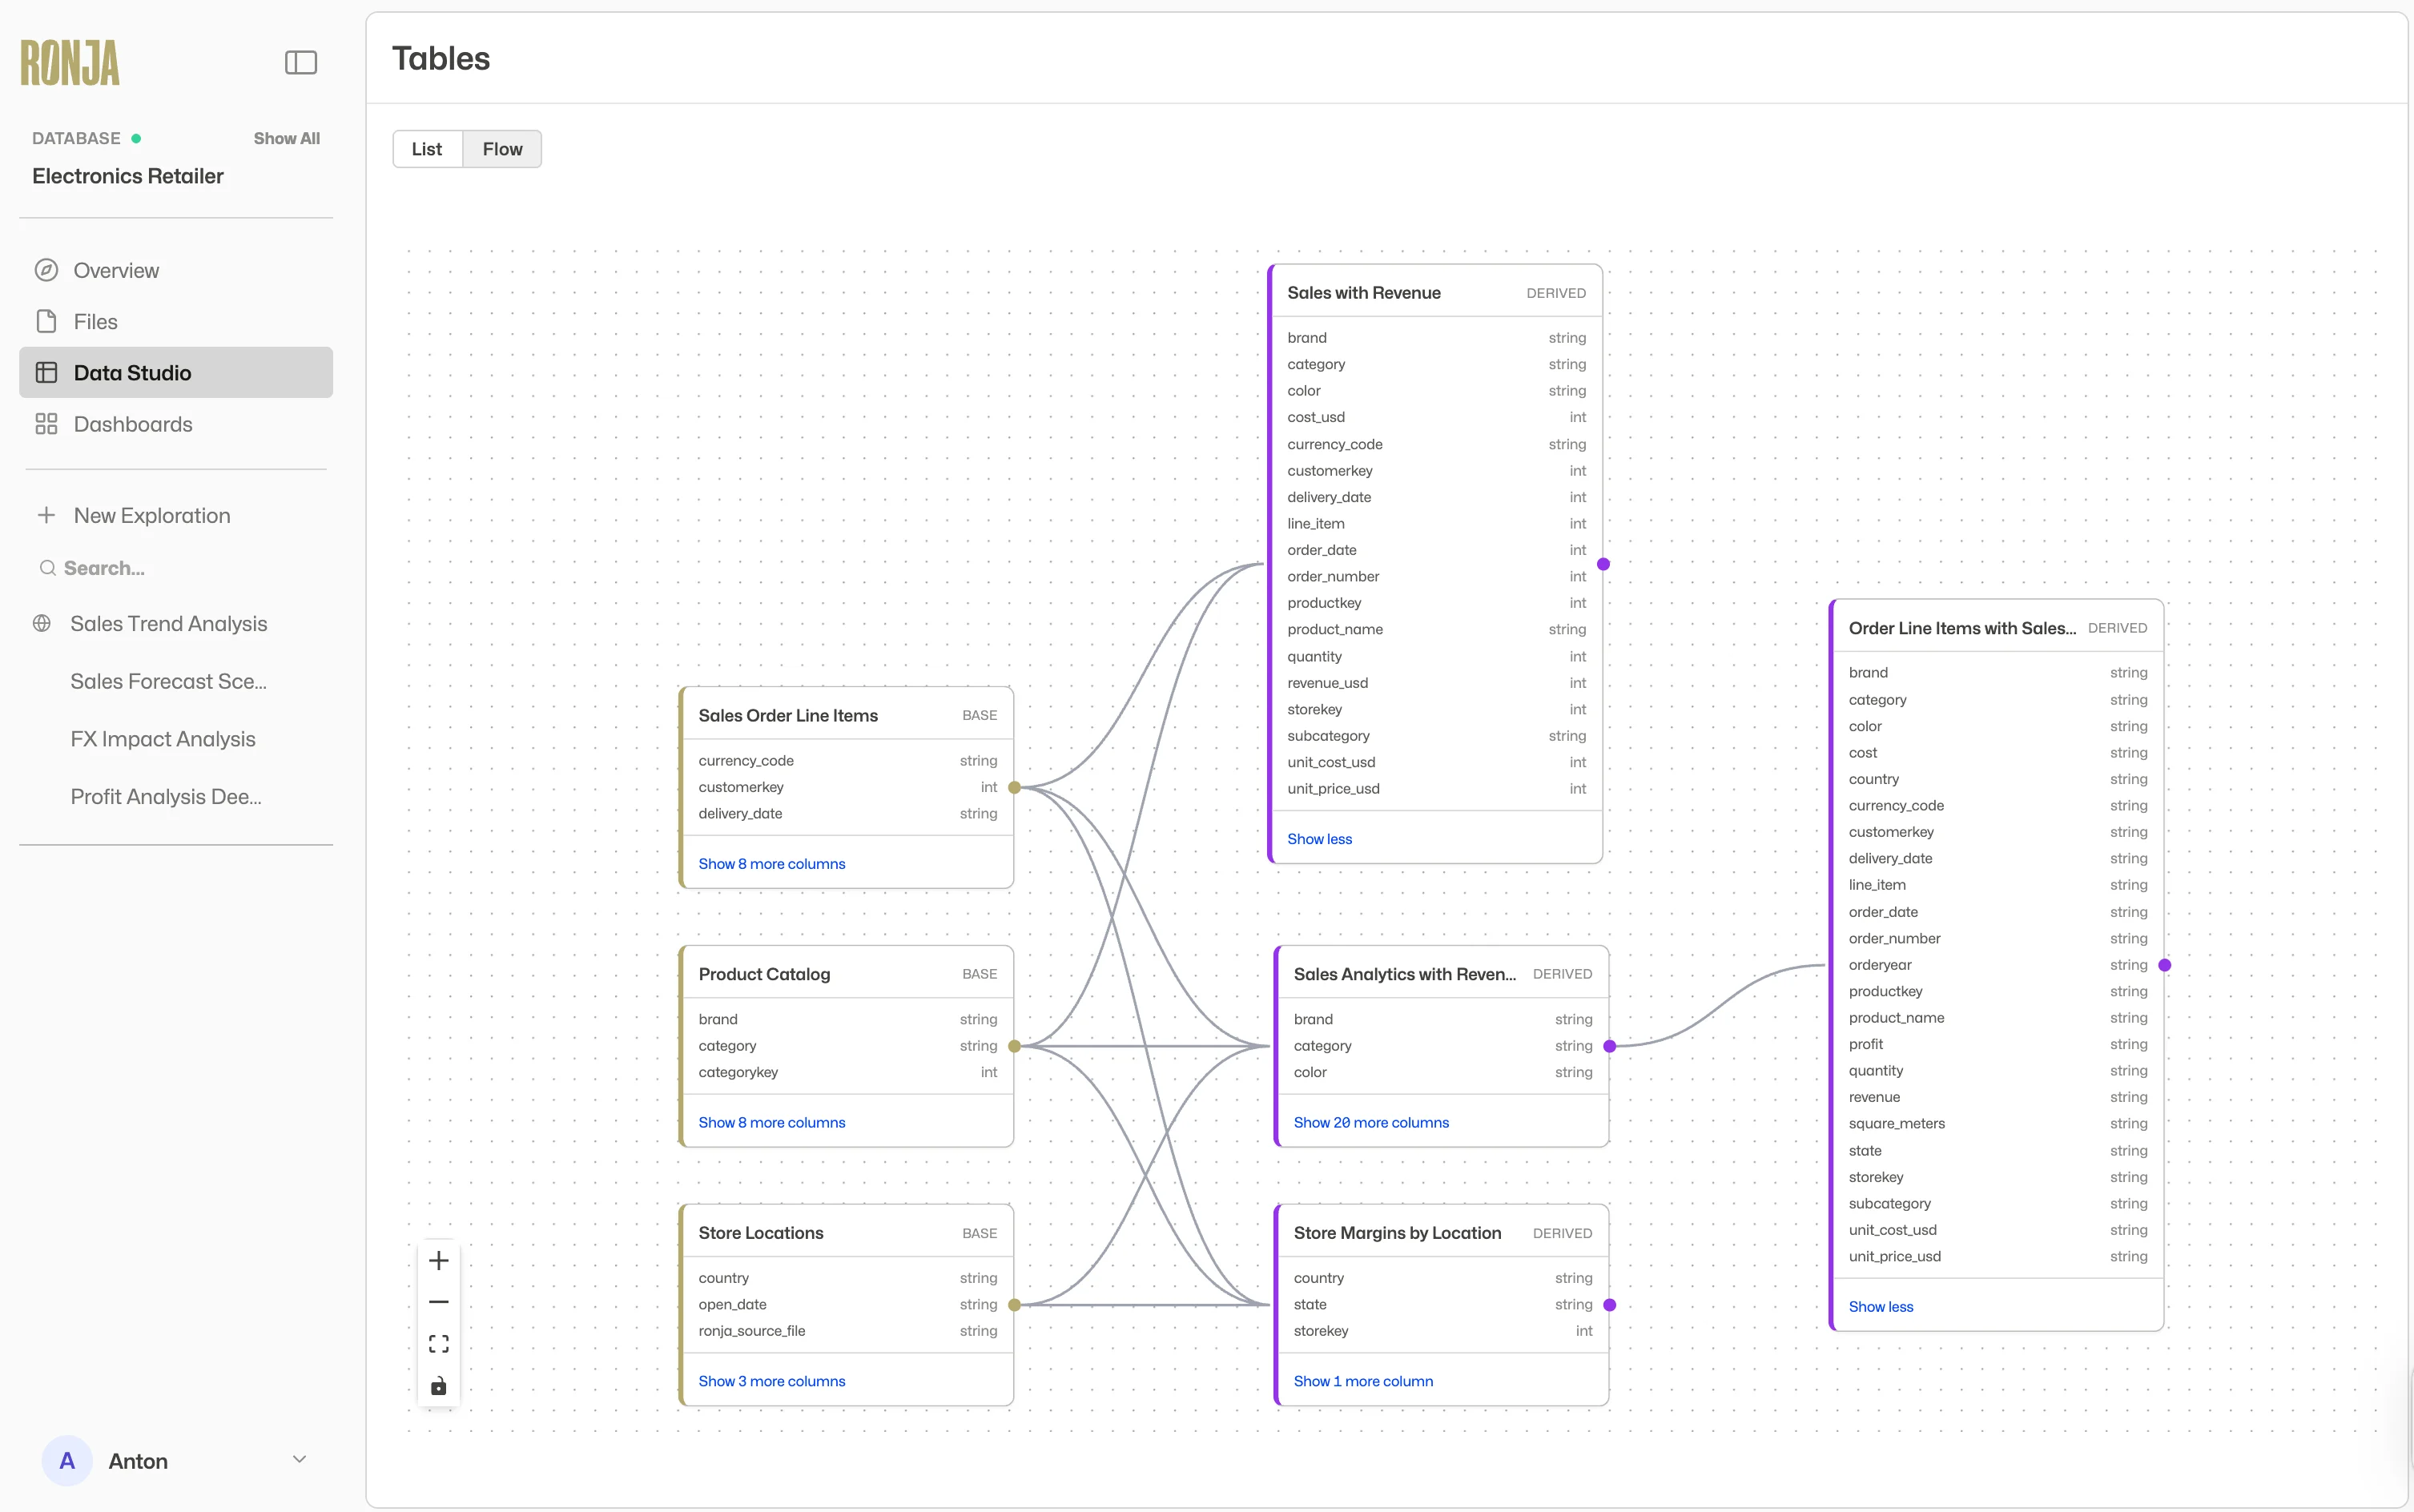
Clean, combine, and join tables from multiple databases. Build pipelines that know what to run and in what order. All in real, auditable code. When the data you need doesn't exist in the right structure, agents build it. Business logic persists as infrastructure, not as one-time chat responses.
Already have dbt models, Looker definitions, or Confluence glossaries? Import them. Ronja's federated context layer reconciles definitions, surfaces where they diverge, and learns from every correction. It doesn't replace what you've built. It makes it work harder.
Exploration
Ask anything. Trace every answer to source.
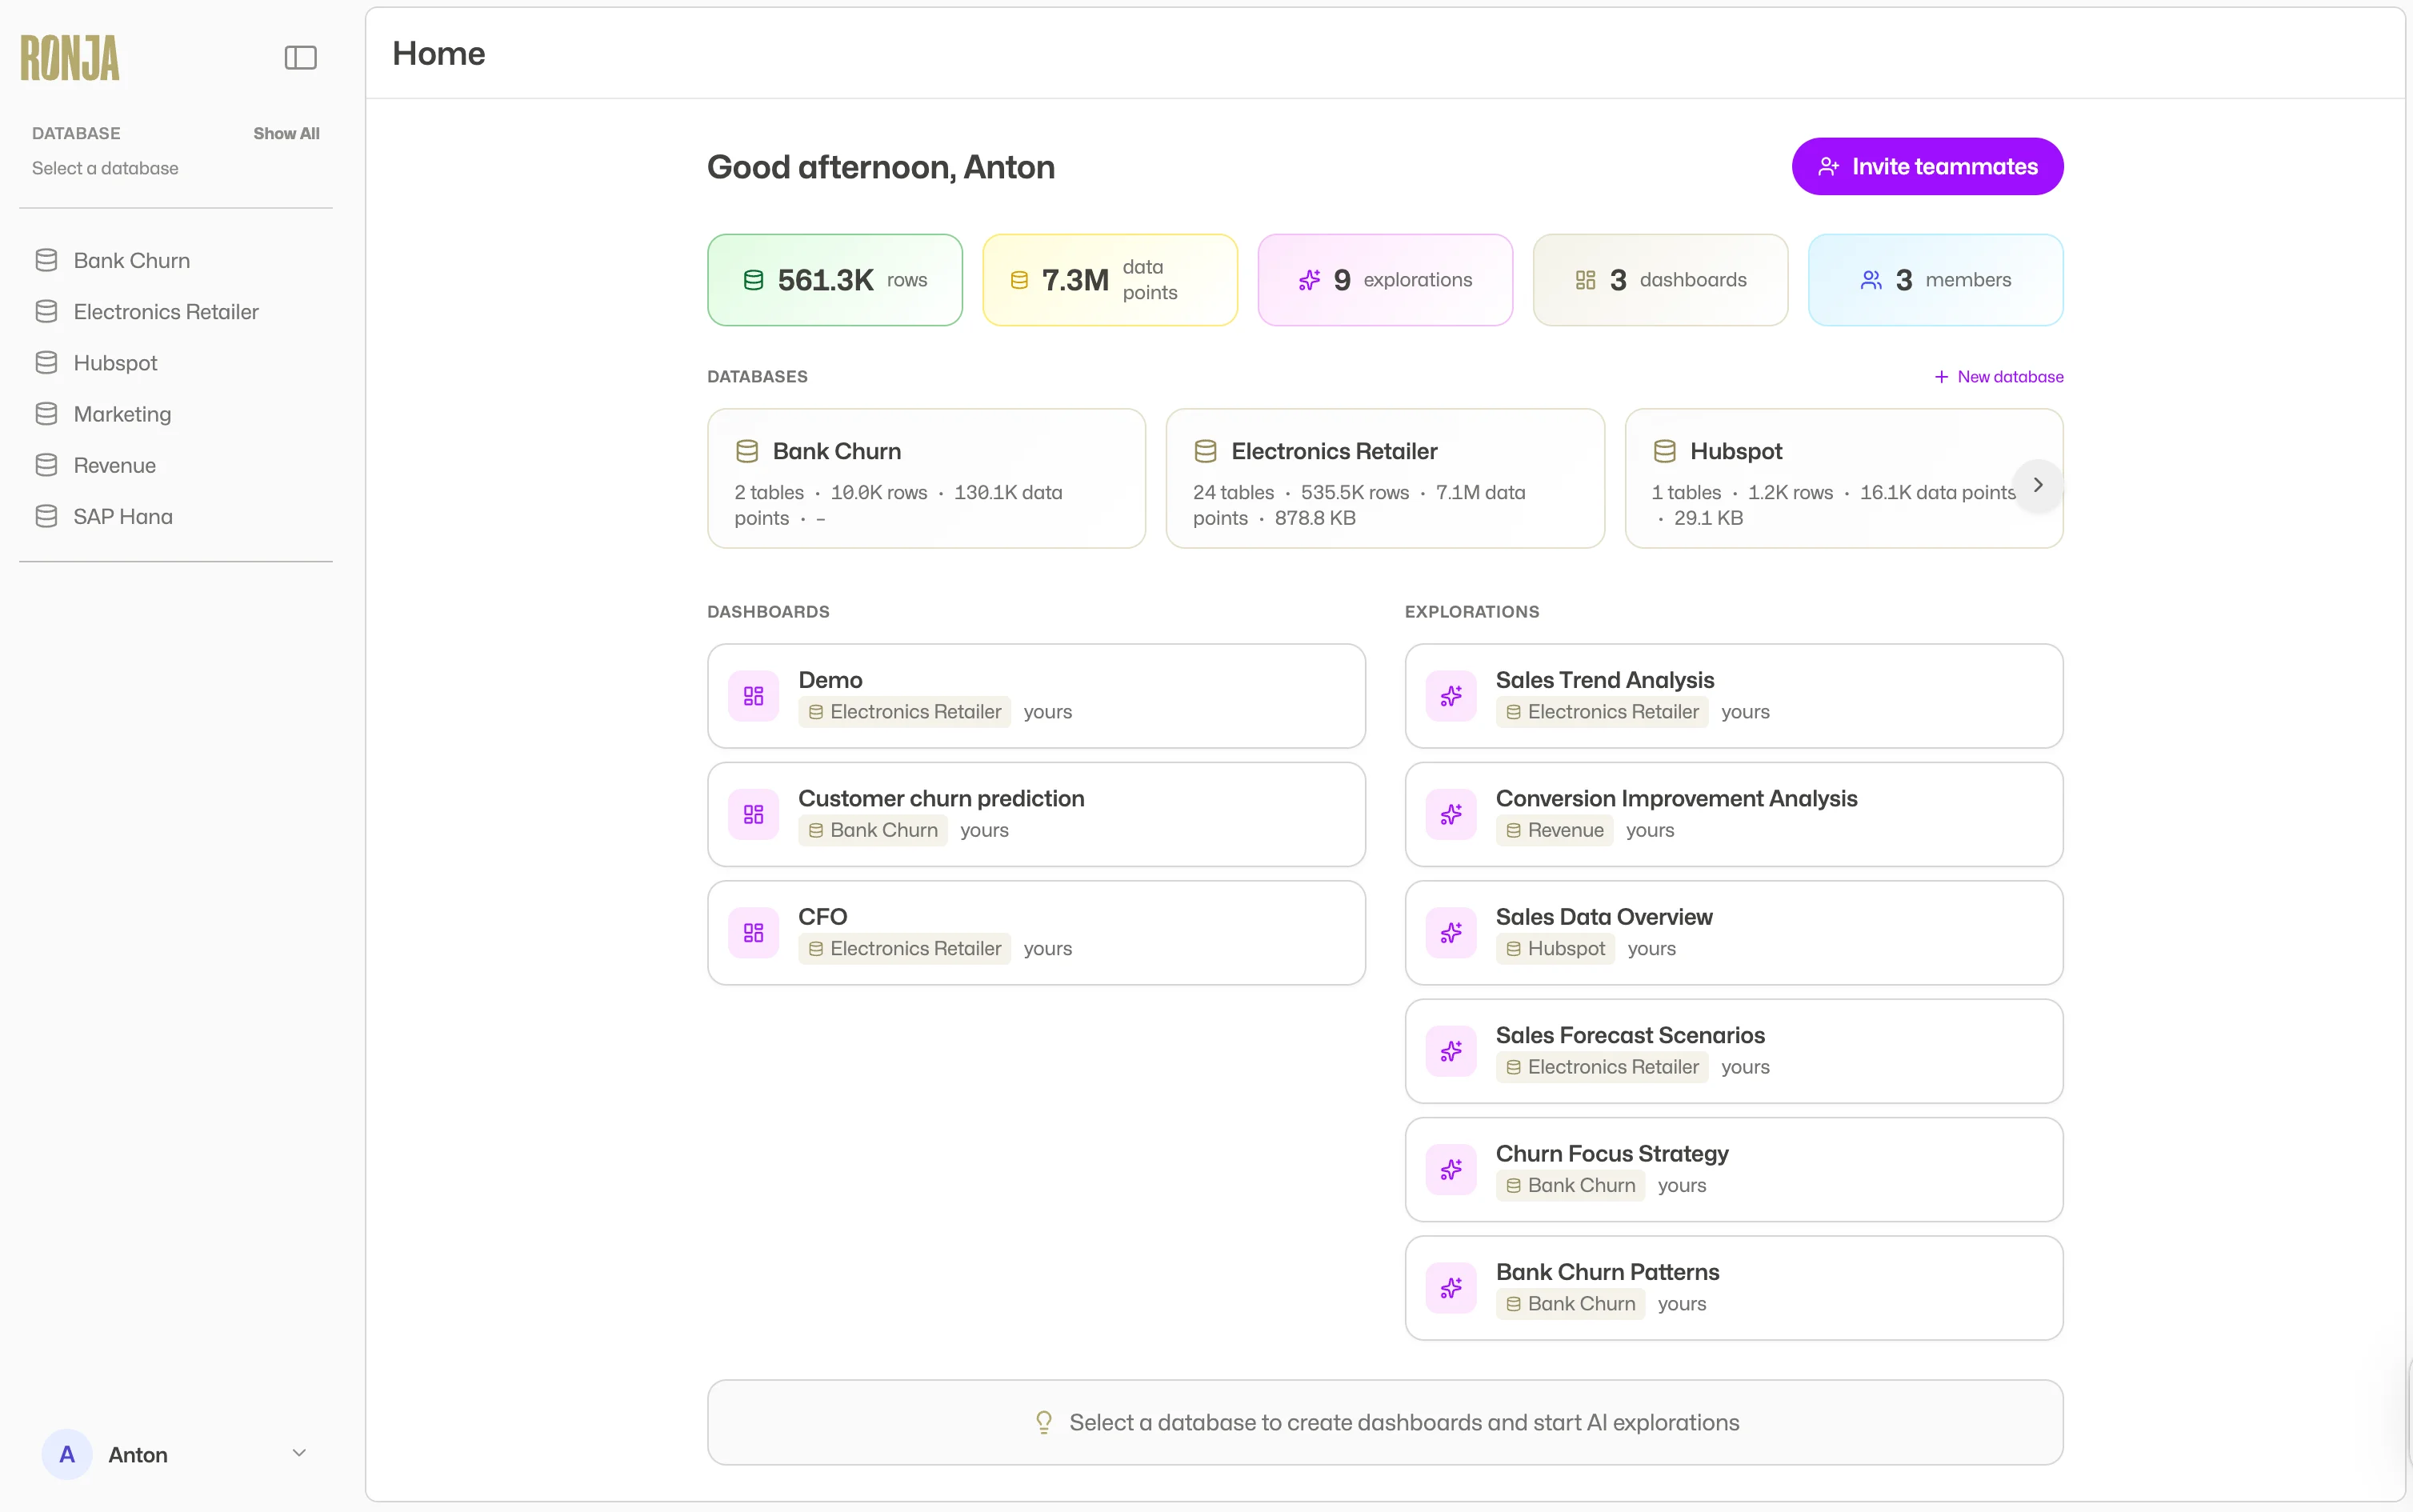
A governed, conversational interface to your data. Ask in plain language, drill into any number, go deeper. Every answer draws from endorsed definitions. Every answer is traceable to source. And every interaction surfaces what the business actually needs.
Data Apps
Dashboards built from endorsed definitions
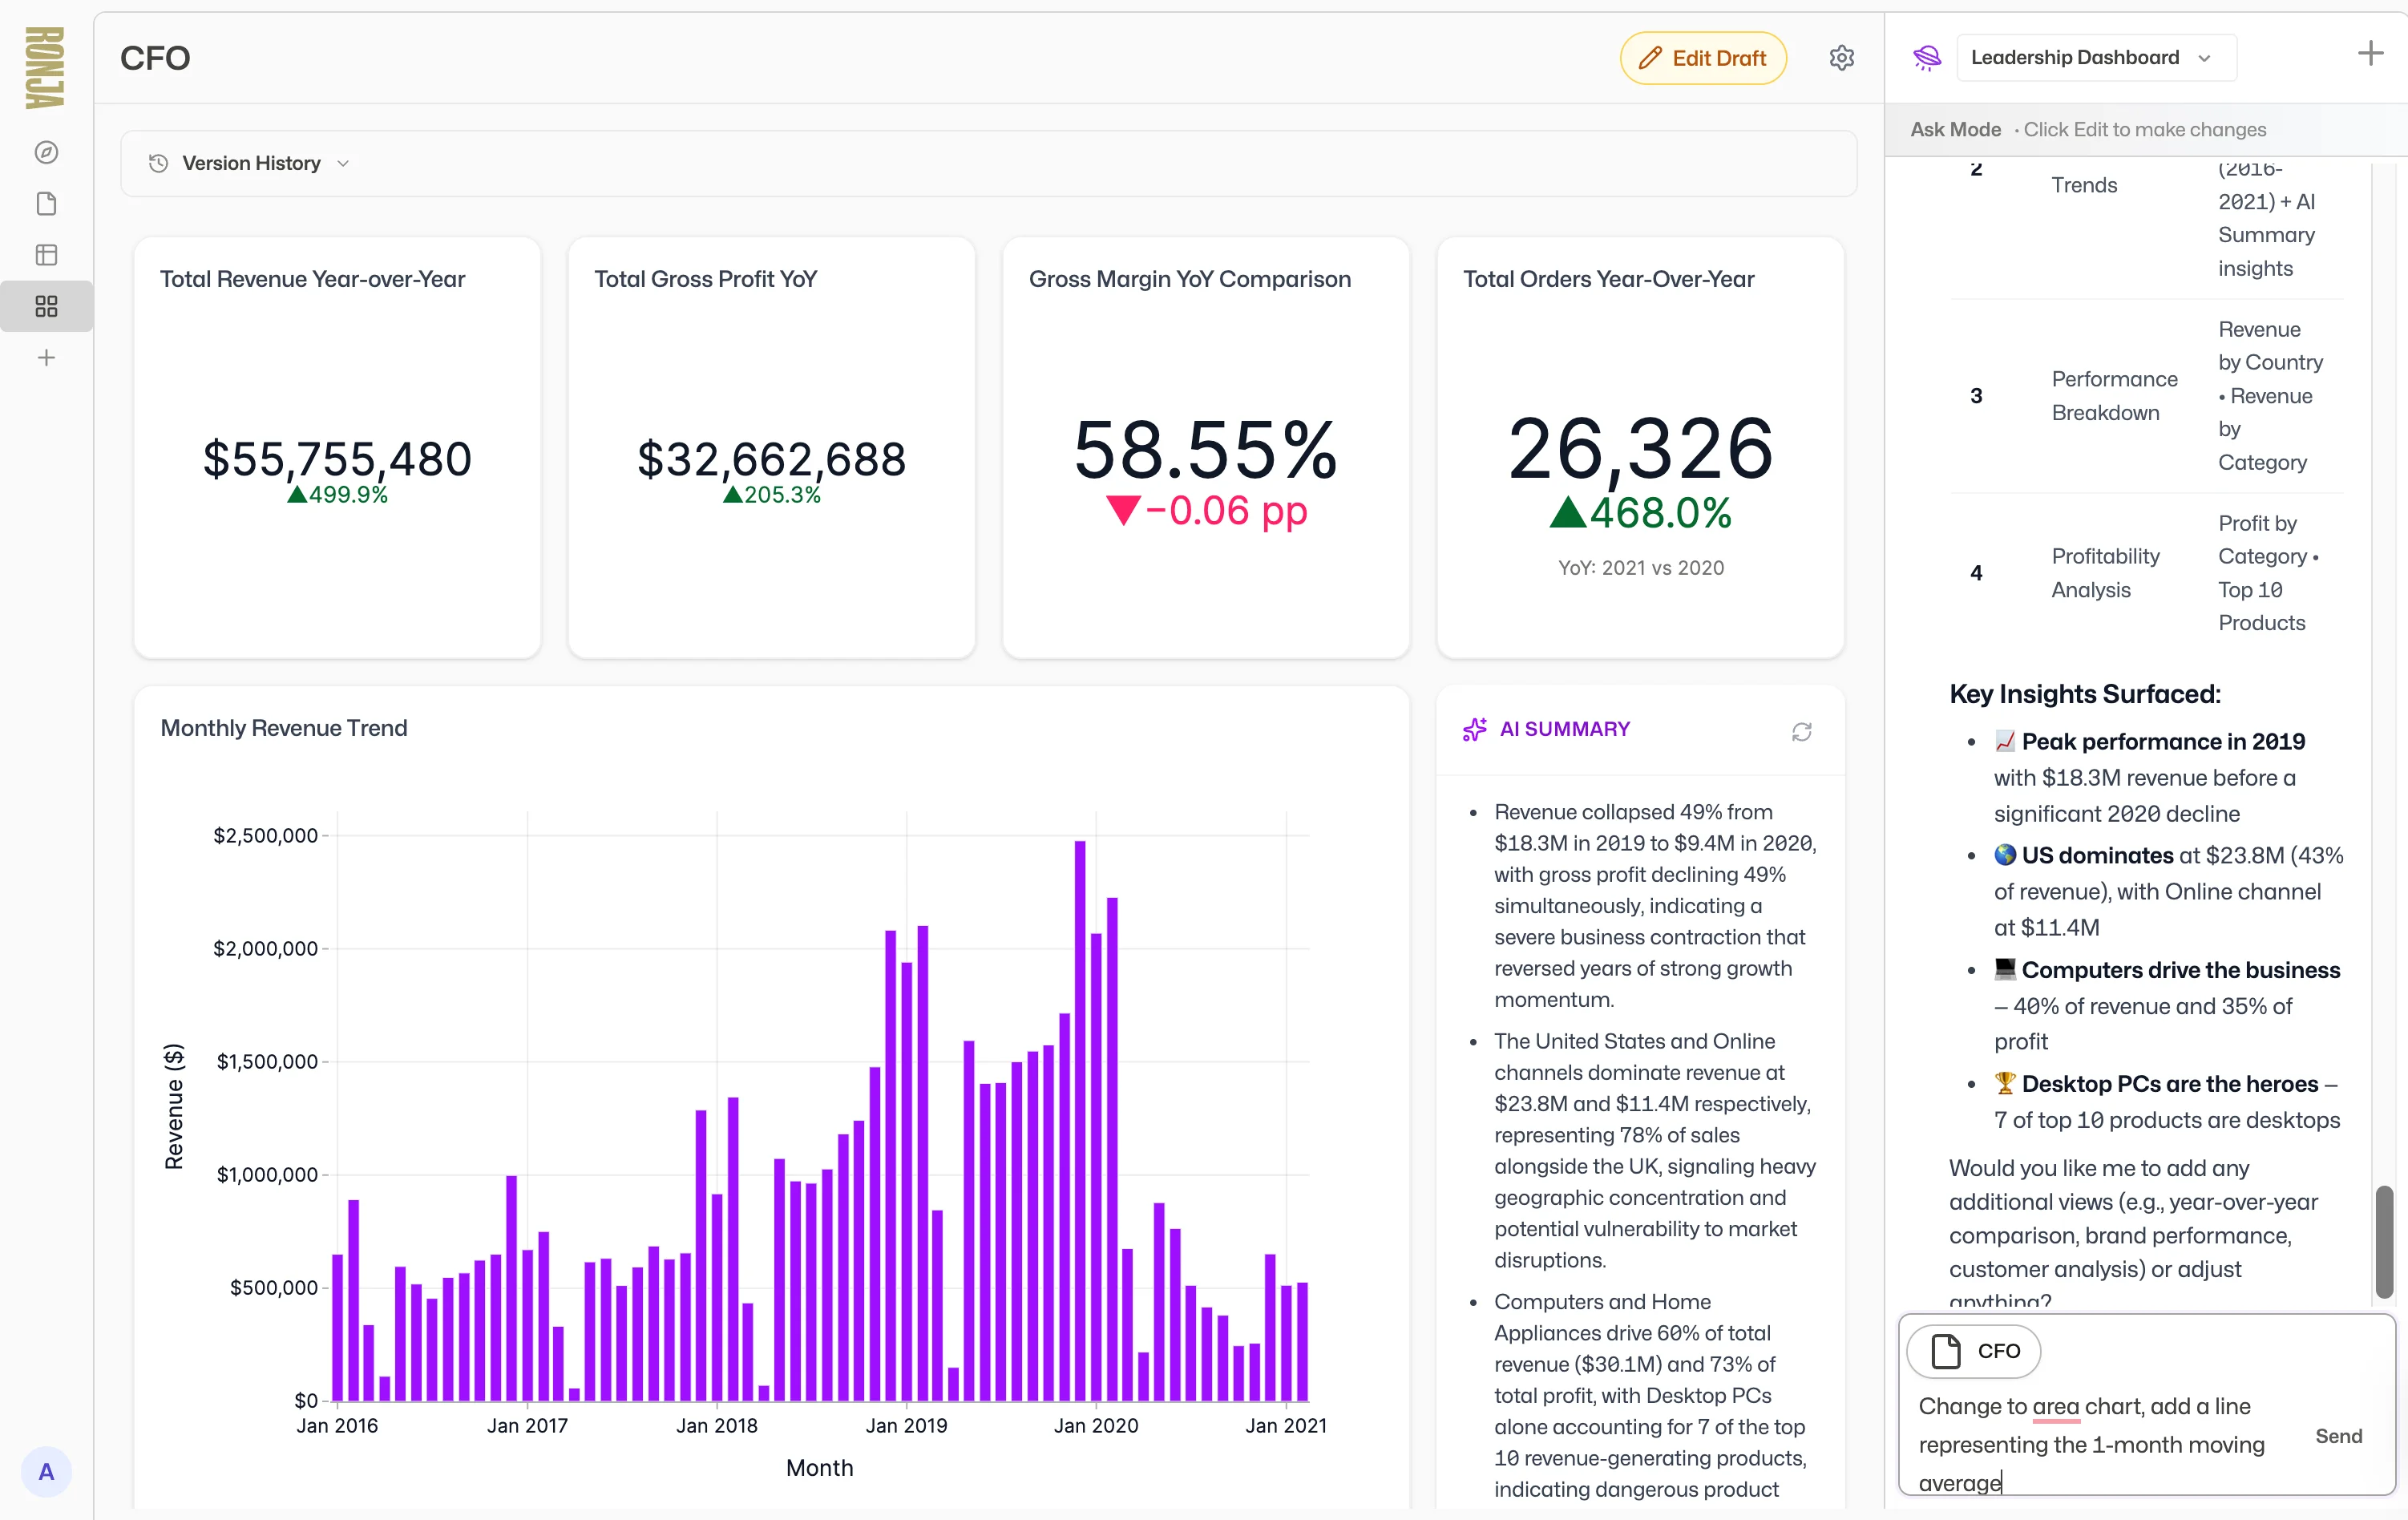
Agents build dashboards using endorsed definitions. Every chart reflects agreed-upon definitions. Click into any number to trace it to source. Every interaction tells the data team what the business actually uses.
Agent Crew
Always-on agents that never sleep
Define missions. Agents follow up on trends, flag deviations, and identify what the data team should build next. Governed by the same definitions and access controls as everything else.
Alert me when customer churn risk increases above 5% monthly threshold.
Flag any order that deviates >20% from plan. 2 orders flagged today
Weekly summary of which ad campaigns outperform. Compare Google Ads vs LinkedIn.
Monitor production scrap rate and notify when it exceeds 2.5% threshold.
Alert me when customer churn risk increases above 5% monthly threshold.
Flag any order that deviates >20% from plan. 2 orders flagged today
Weekly summary of which ad campaigns outperform. Compare Google Ads vs LinkedIn.
Monitor production scrap rate and notify when it exceeds 2.5% threshold.
AI can't predict numbers. But it can write the code that calculates them.
How it works
Four steps. One platform.
Connect your sources
Upload files or use pre-built connectors. Ronja syncs data from HubSpot, Salesforce, Fortnox, Postgres, Excel, and 100+ more sources into its own execution layer. Your warehouse stays untouched.
The data layer builds itself
When you ask a question and the data doesn't exist in the right structure, agents build it. They write real transformation code. Deterministic, versioned, traceable.
Everyone gets answers
Ask questions in plain language, explore dashboards, set up monitoring agents, or get reports in email and Slack. The whole company can use the data. Every answer governed by the same access controls and endorsed definitions. No SQL required.
Ronja learns your organization
The federated context layer learns your terminology, business rules, and metric definitions over time. Where definitions diverge, Ronja surfaces the evidence. The data team adjudicates; Ronja compounds.
Delivery
Get answers where you work
Automated reports in your inbox on Monday morning. Slack alerts when a metric breaks a threshold. A weekly email summary for your CFO. Real-time notifications for your ops team. No one needs to log in to anything.
Highlights:
• 3 new customers signed (€4,500 MRR added)
• Enterprise tier upsell closed
• Churn risk flagged for 1 account
Reply to this email to ask follow-up questions →
Memos
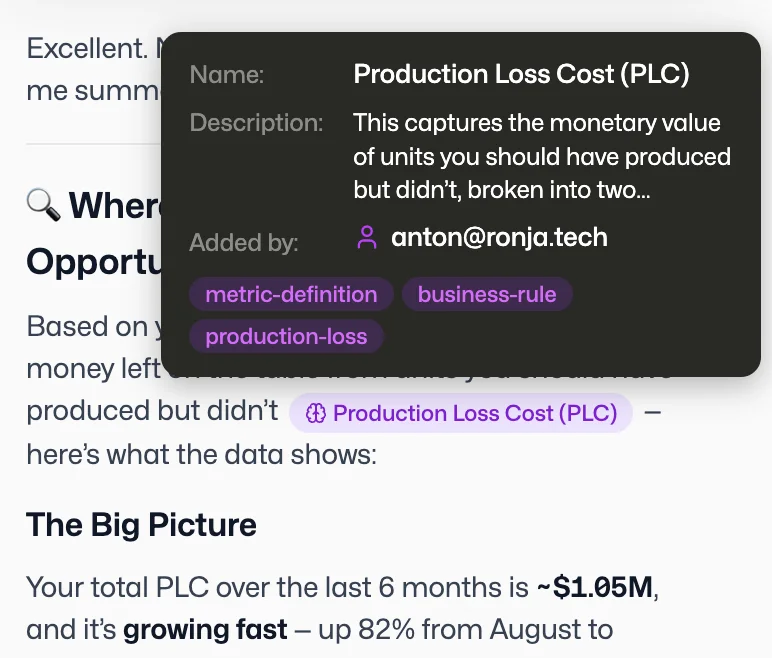
Your data has structure. Memos give it meaning.
A memo is a persistent knowledge node. It stores business rules, terminology, data quality notes, and domain conventions. Agents and users use memos to understand what data means, not just what it looks like. The more your team adds, the smarter the platform gets.
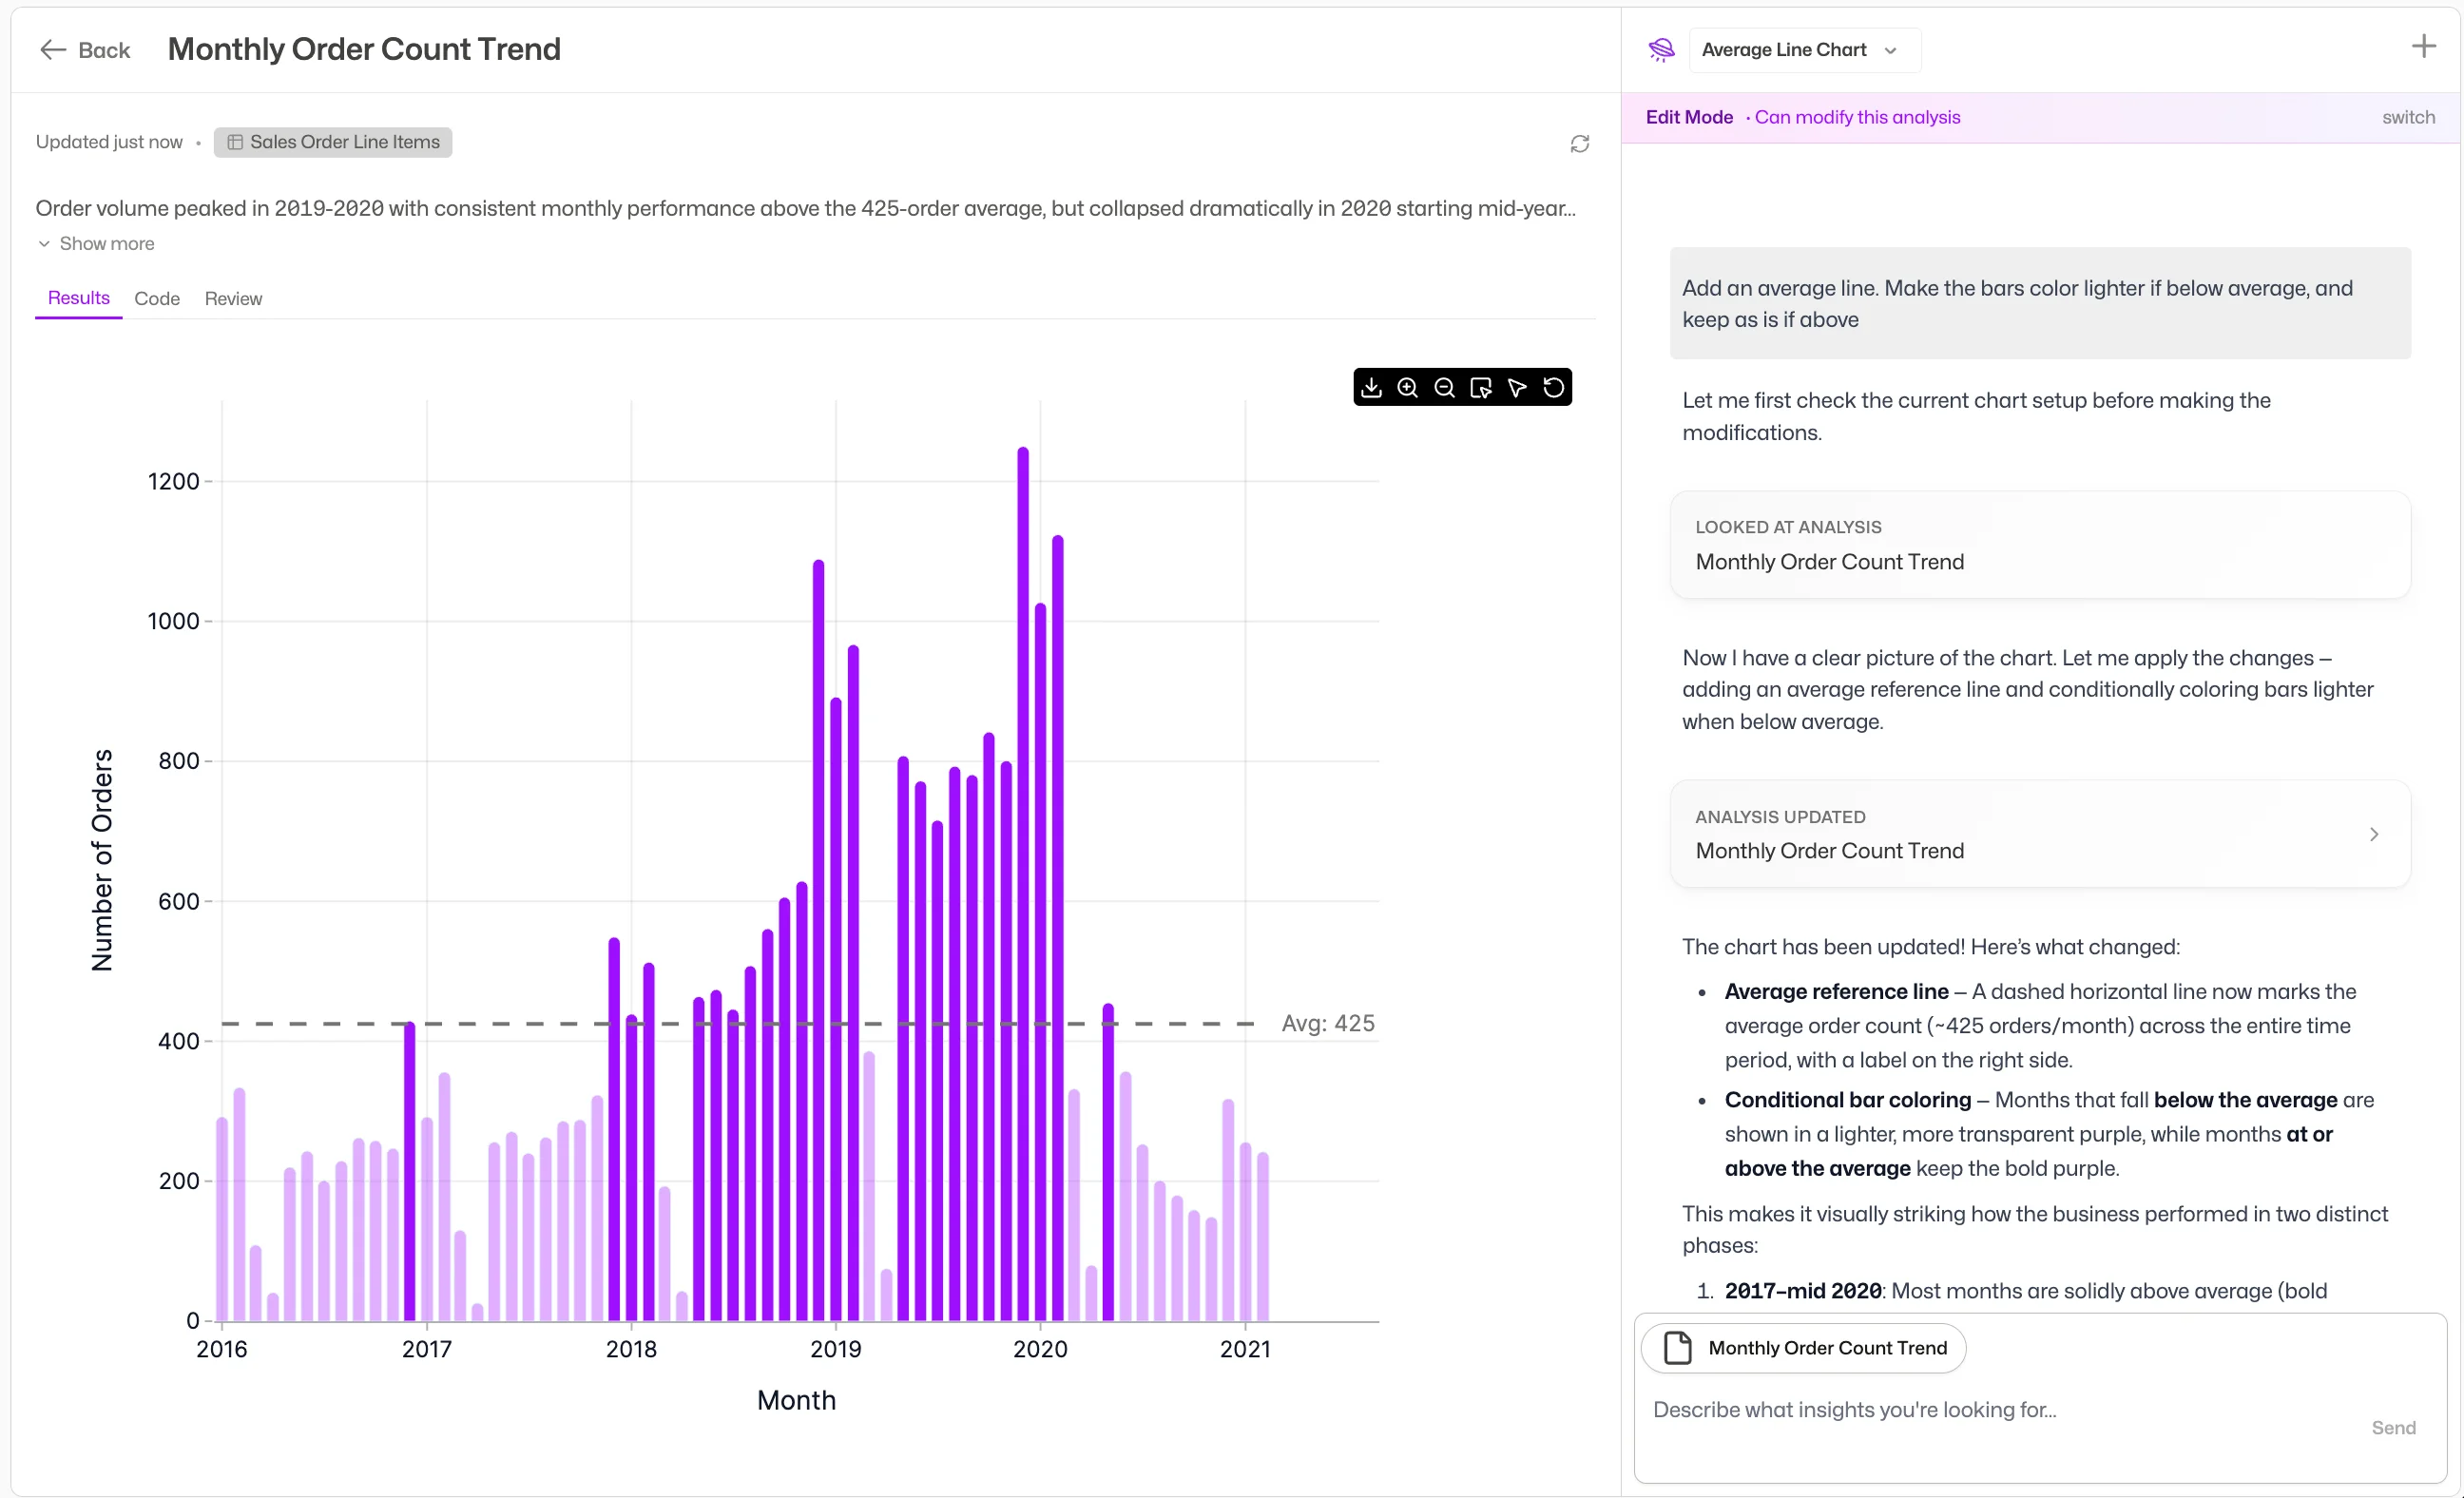
Visualization
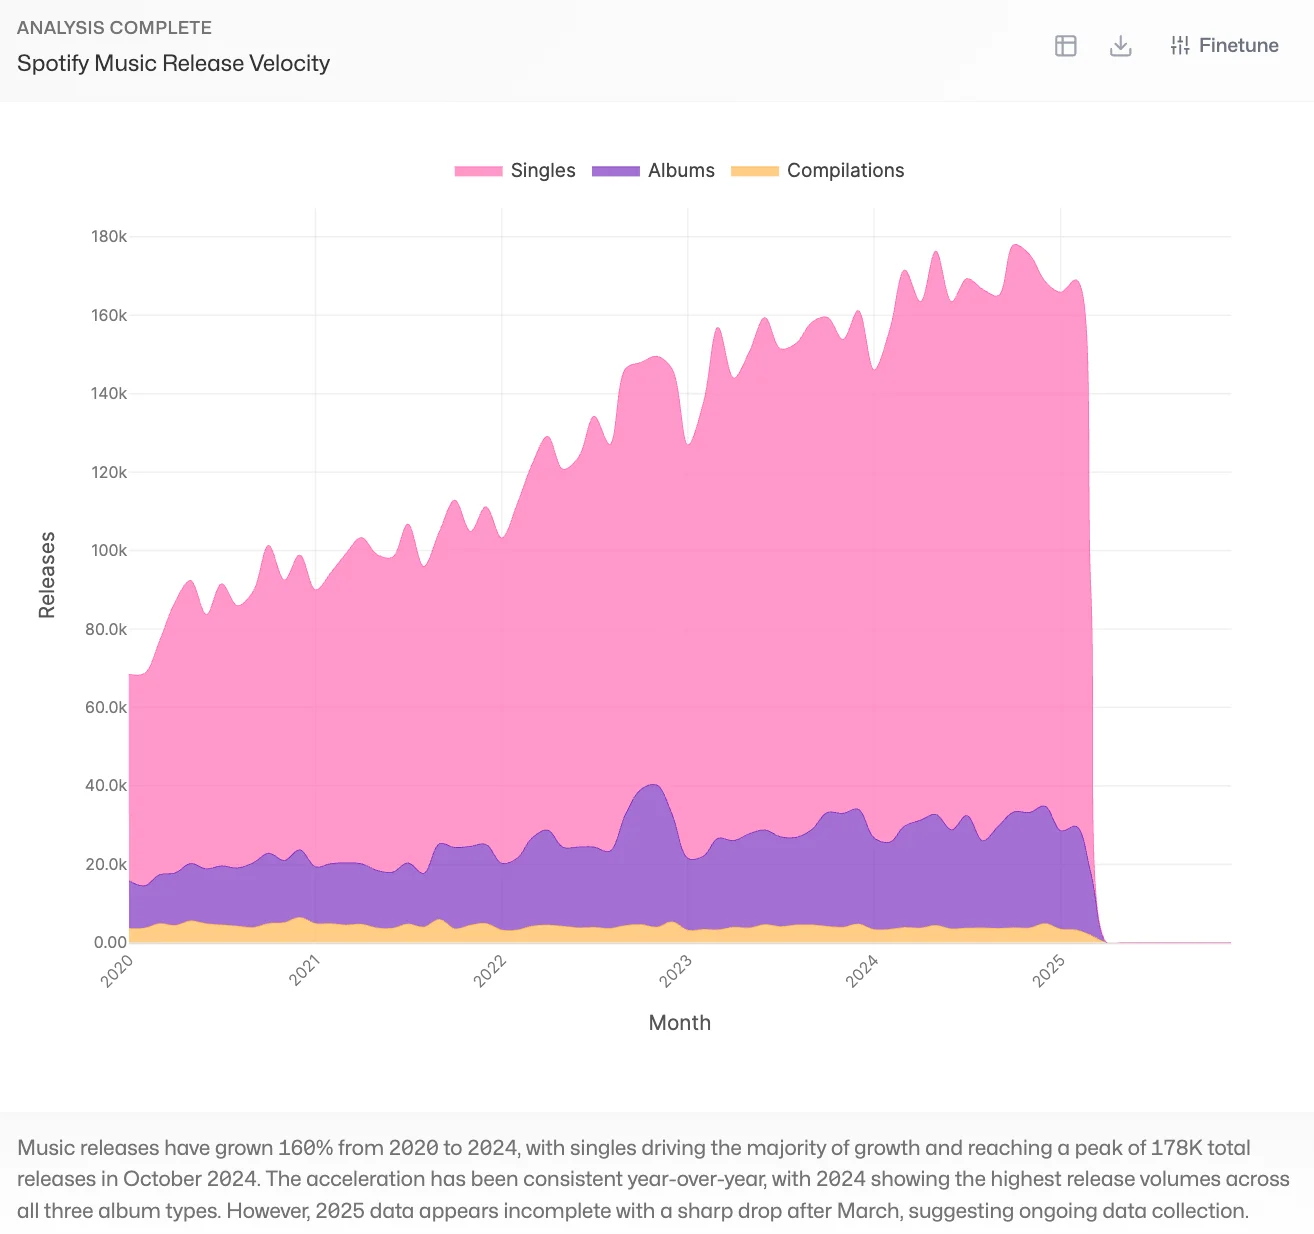
Accurate charts, built by agents.
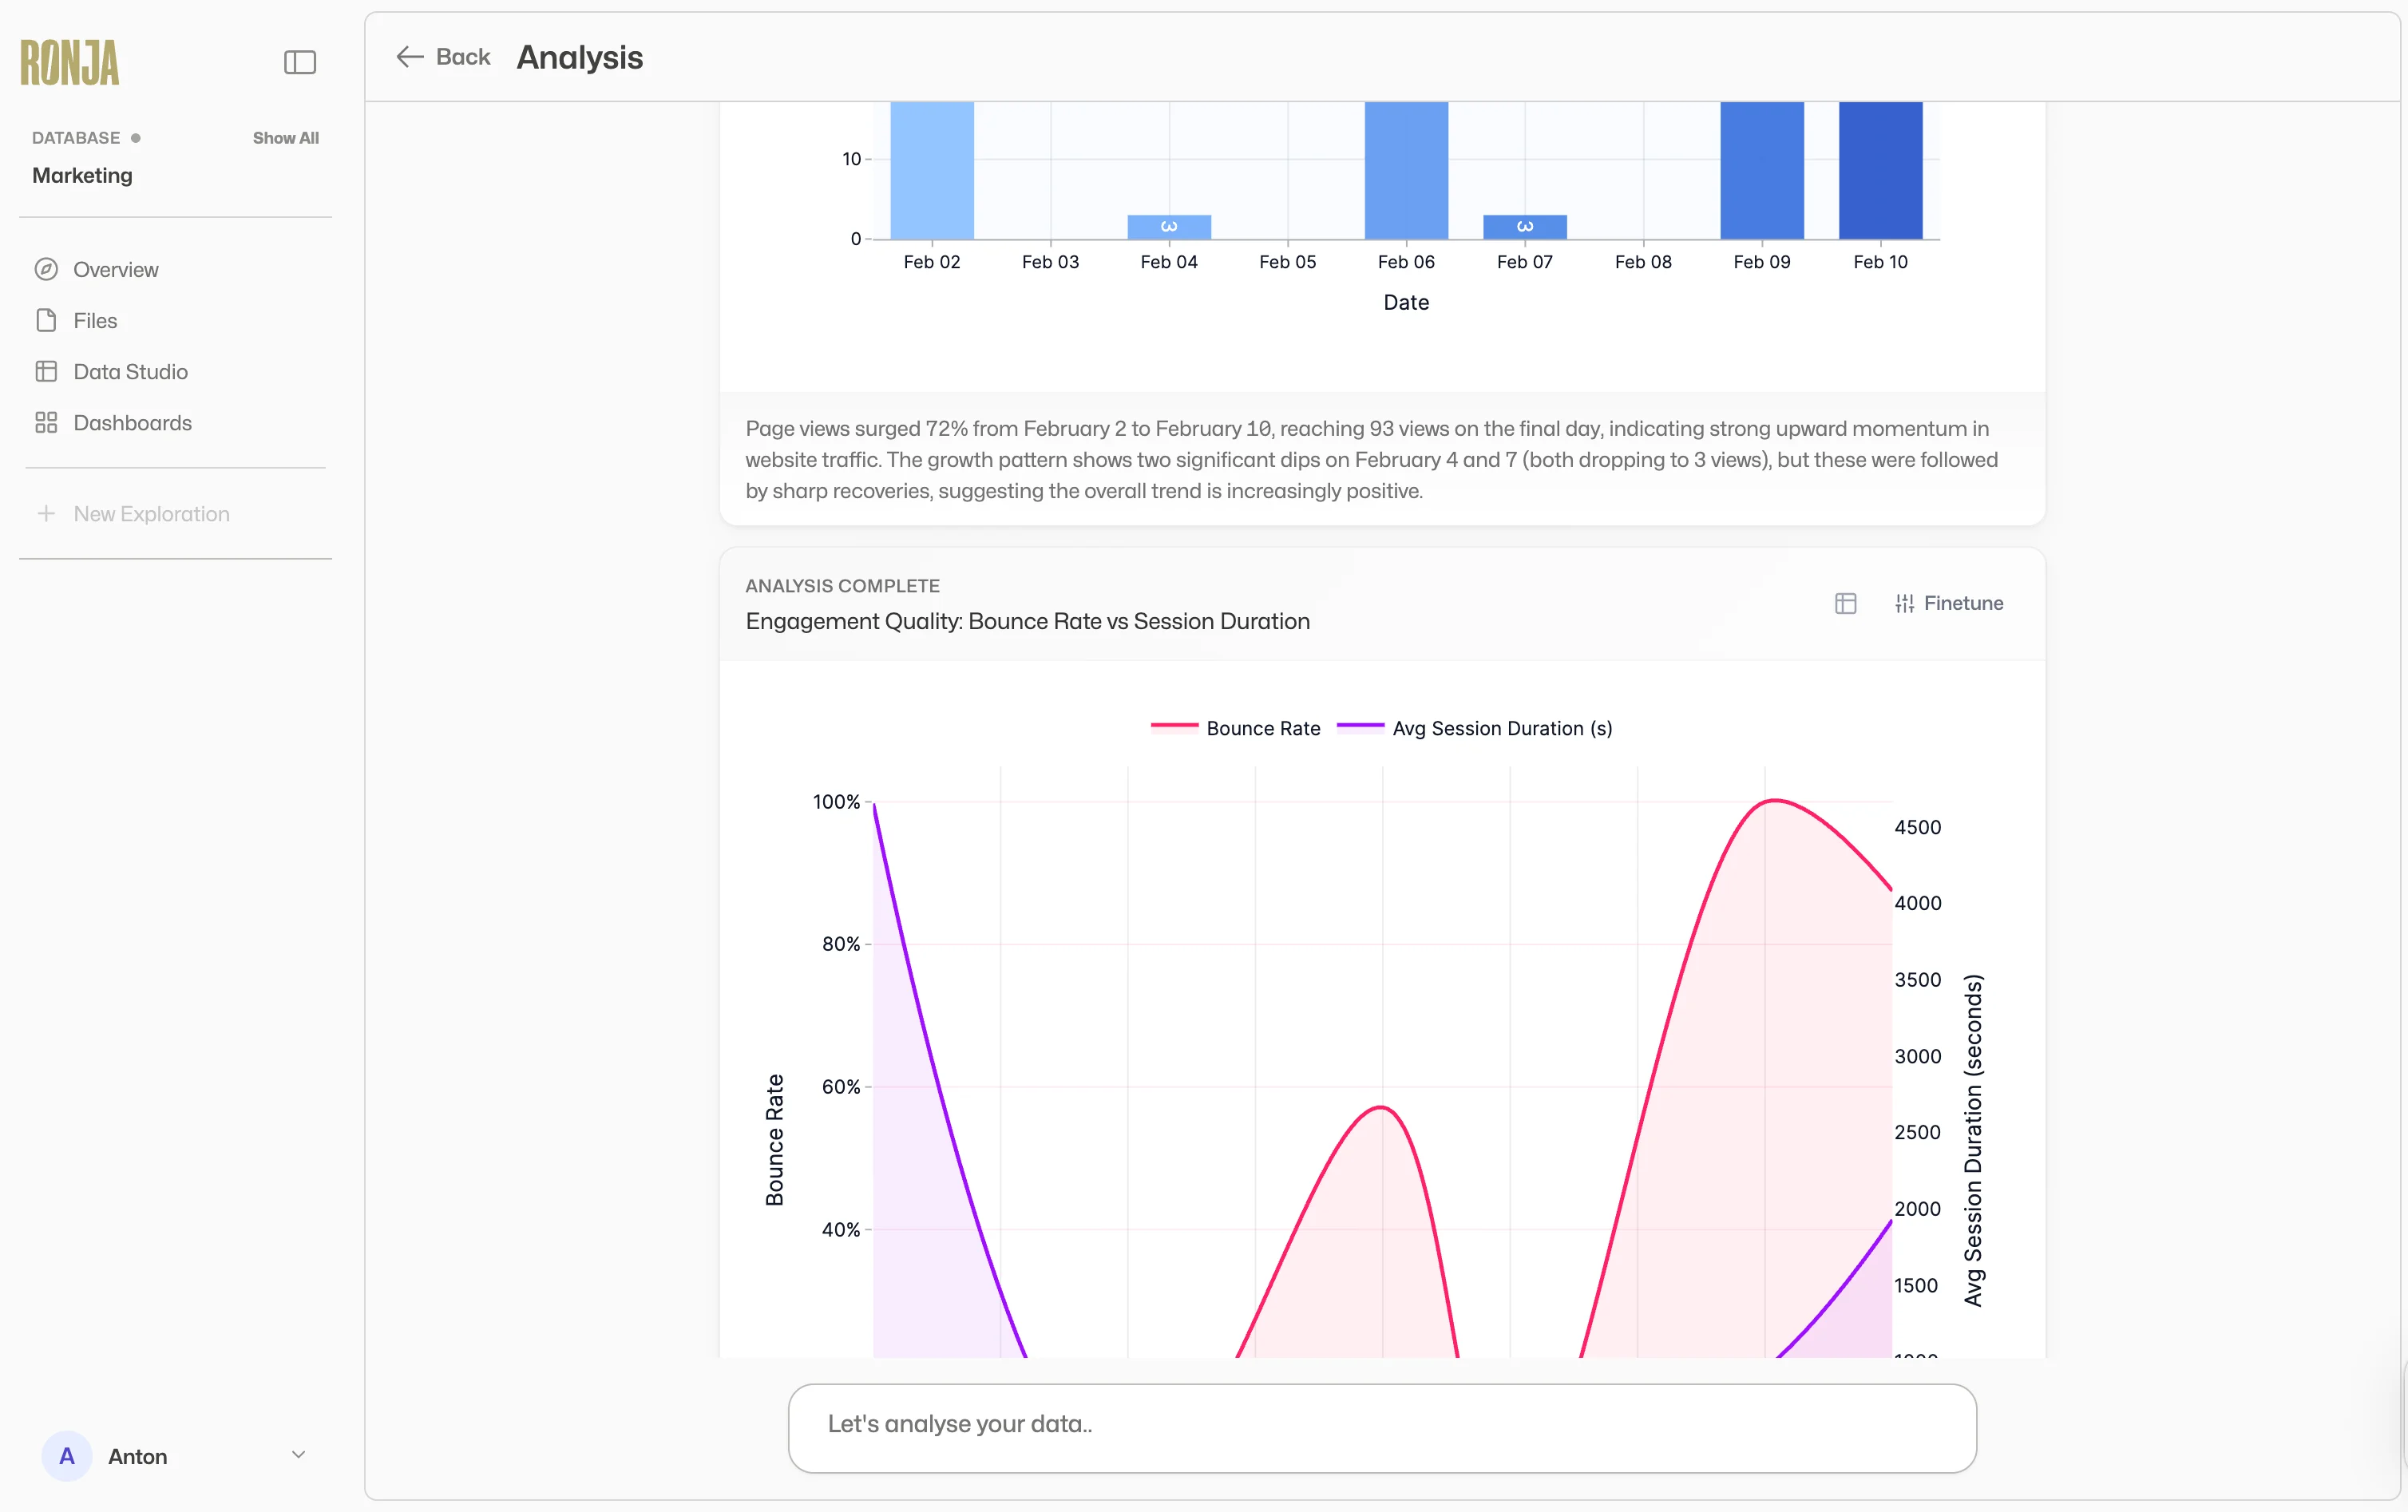
Ask a question, get a chart. Ronja's agents turn your data into clear, ready-to-share visualizations. Every chart traces to source. Every metric uses endorsed definitions. Always up to date, always accurate.
Full flexibility
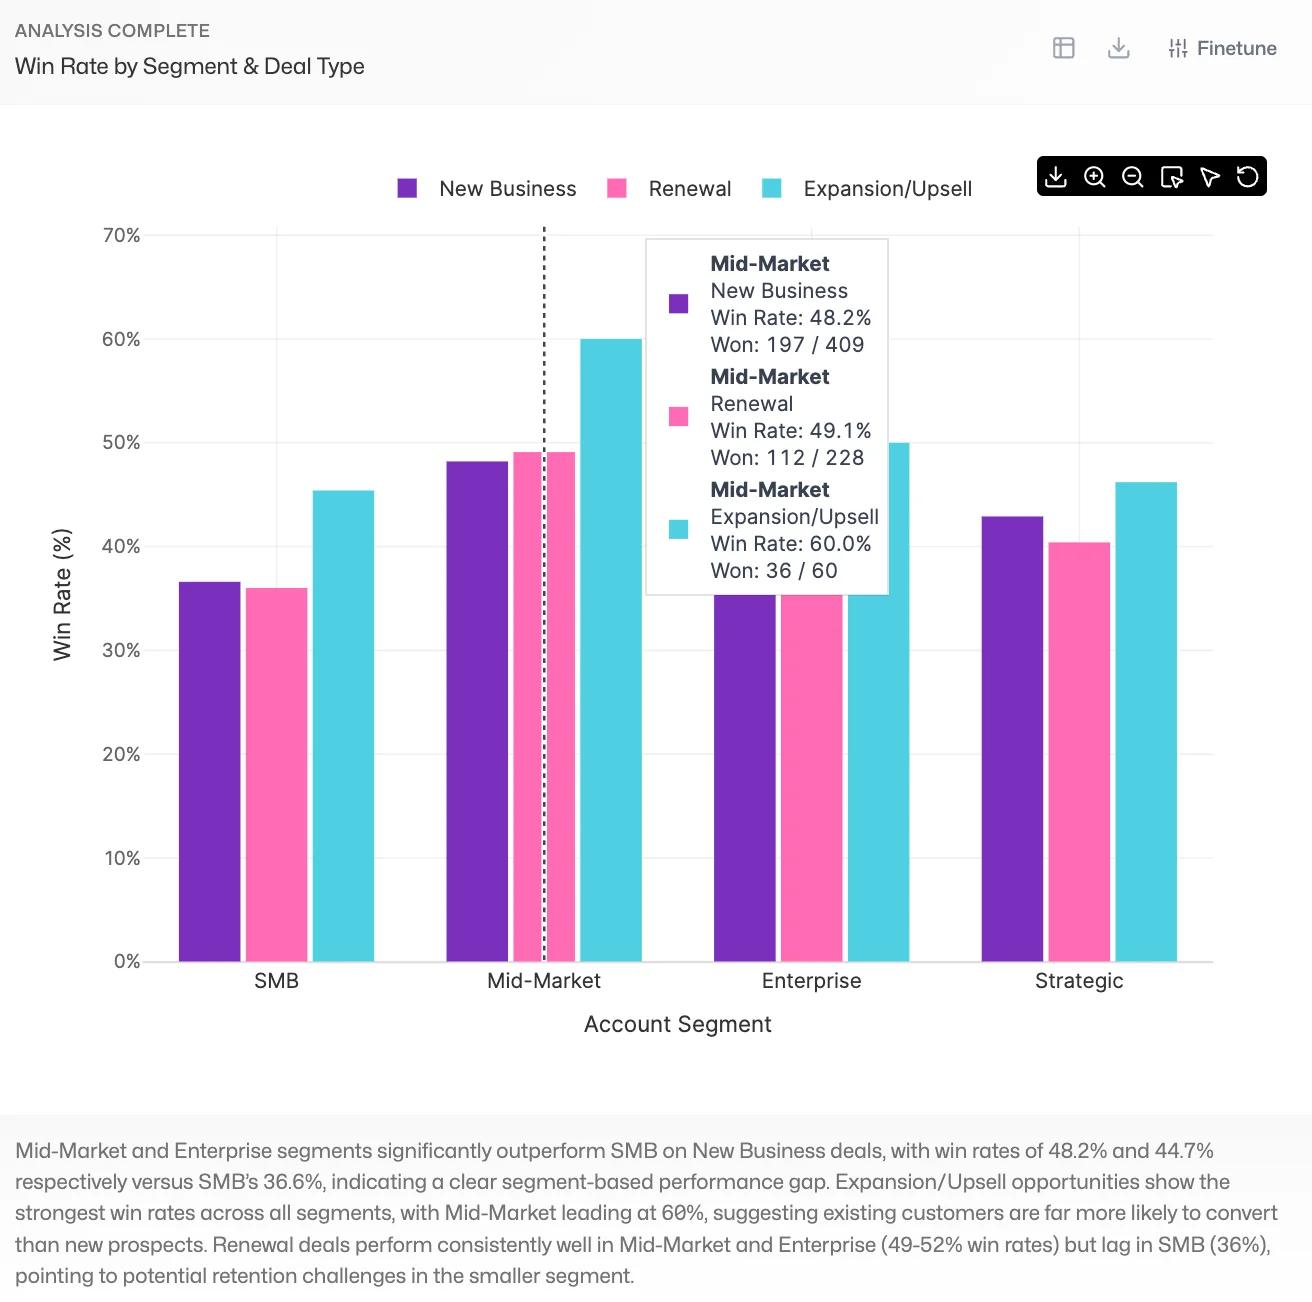
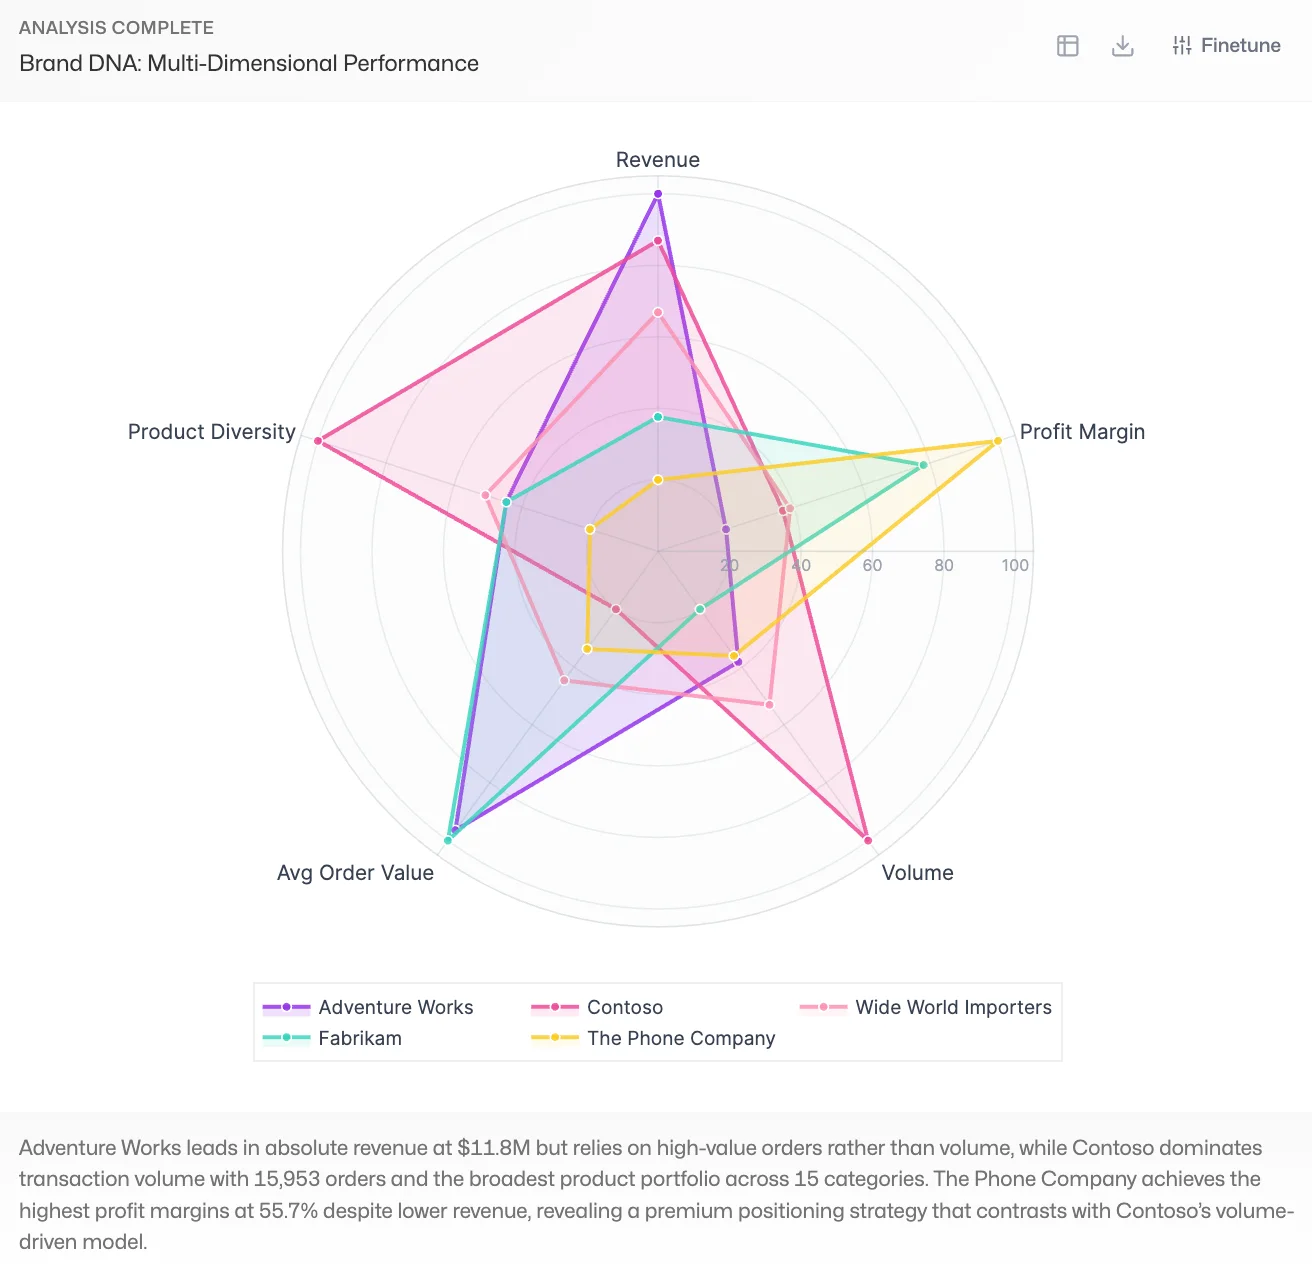
If you can imagine it, Ronja can build it.
Want to add a new line to your chart? Tweak a breakdown? Combine sales data with production numbers? Just describe what you want. If the data exists, agents update your visualization. If it doesn't, they pull in new sources and build the dataset for you.
No SQL, no data engineering tickets, no waiting. You focus on the question. Agents handle the data work. Your team governs the output.
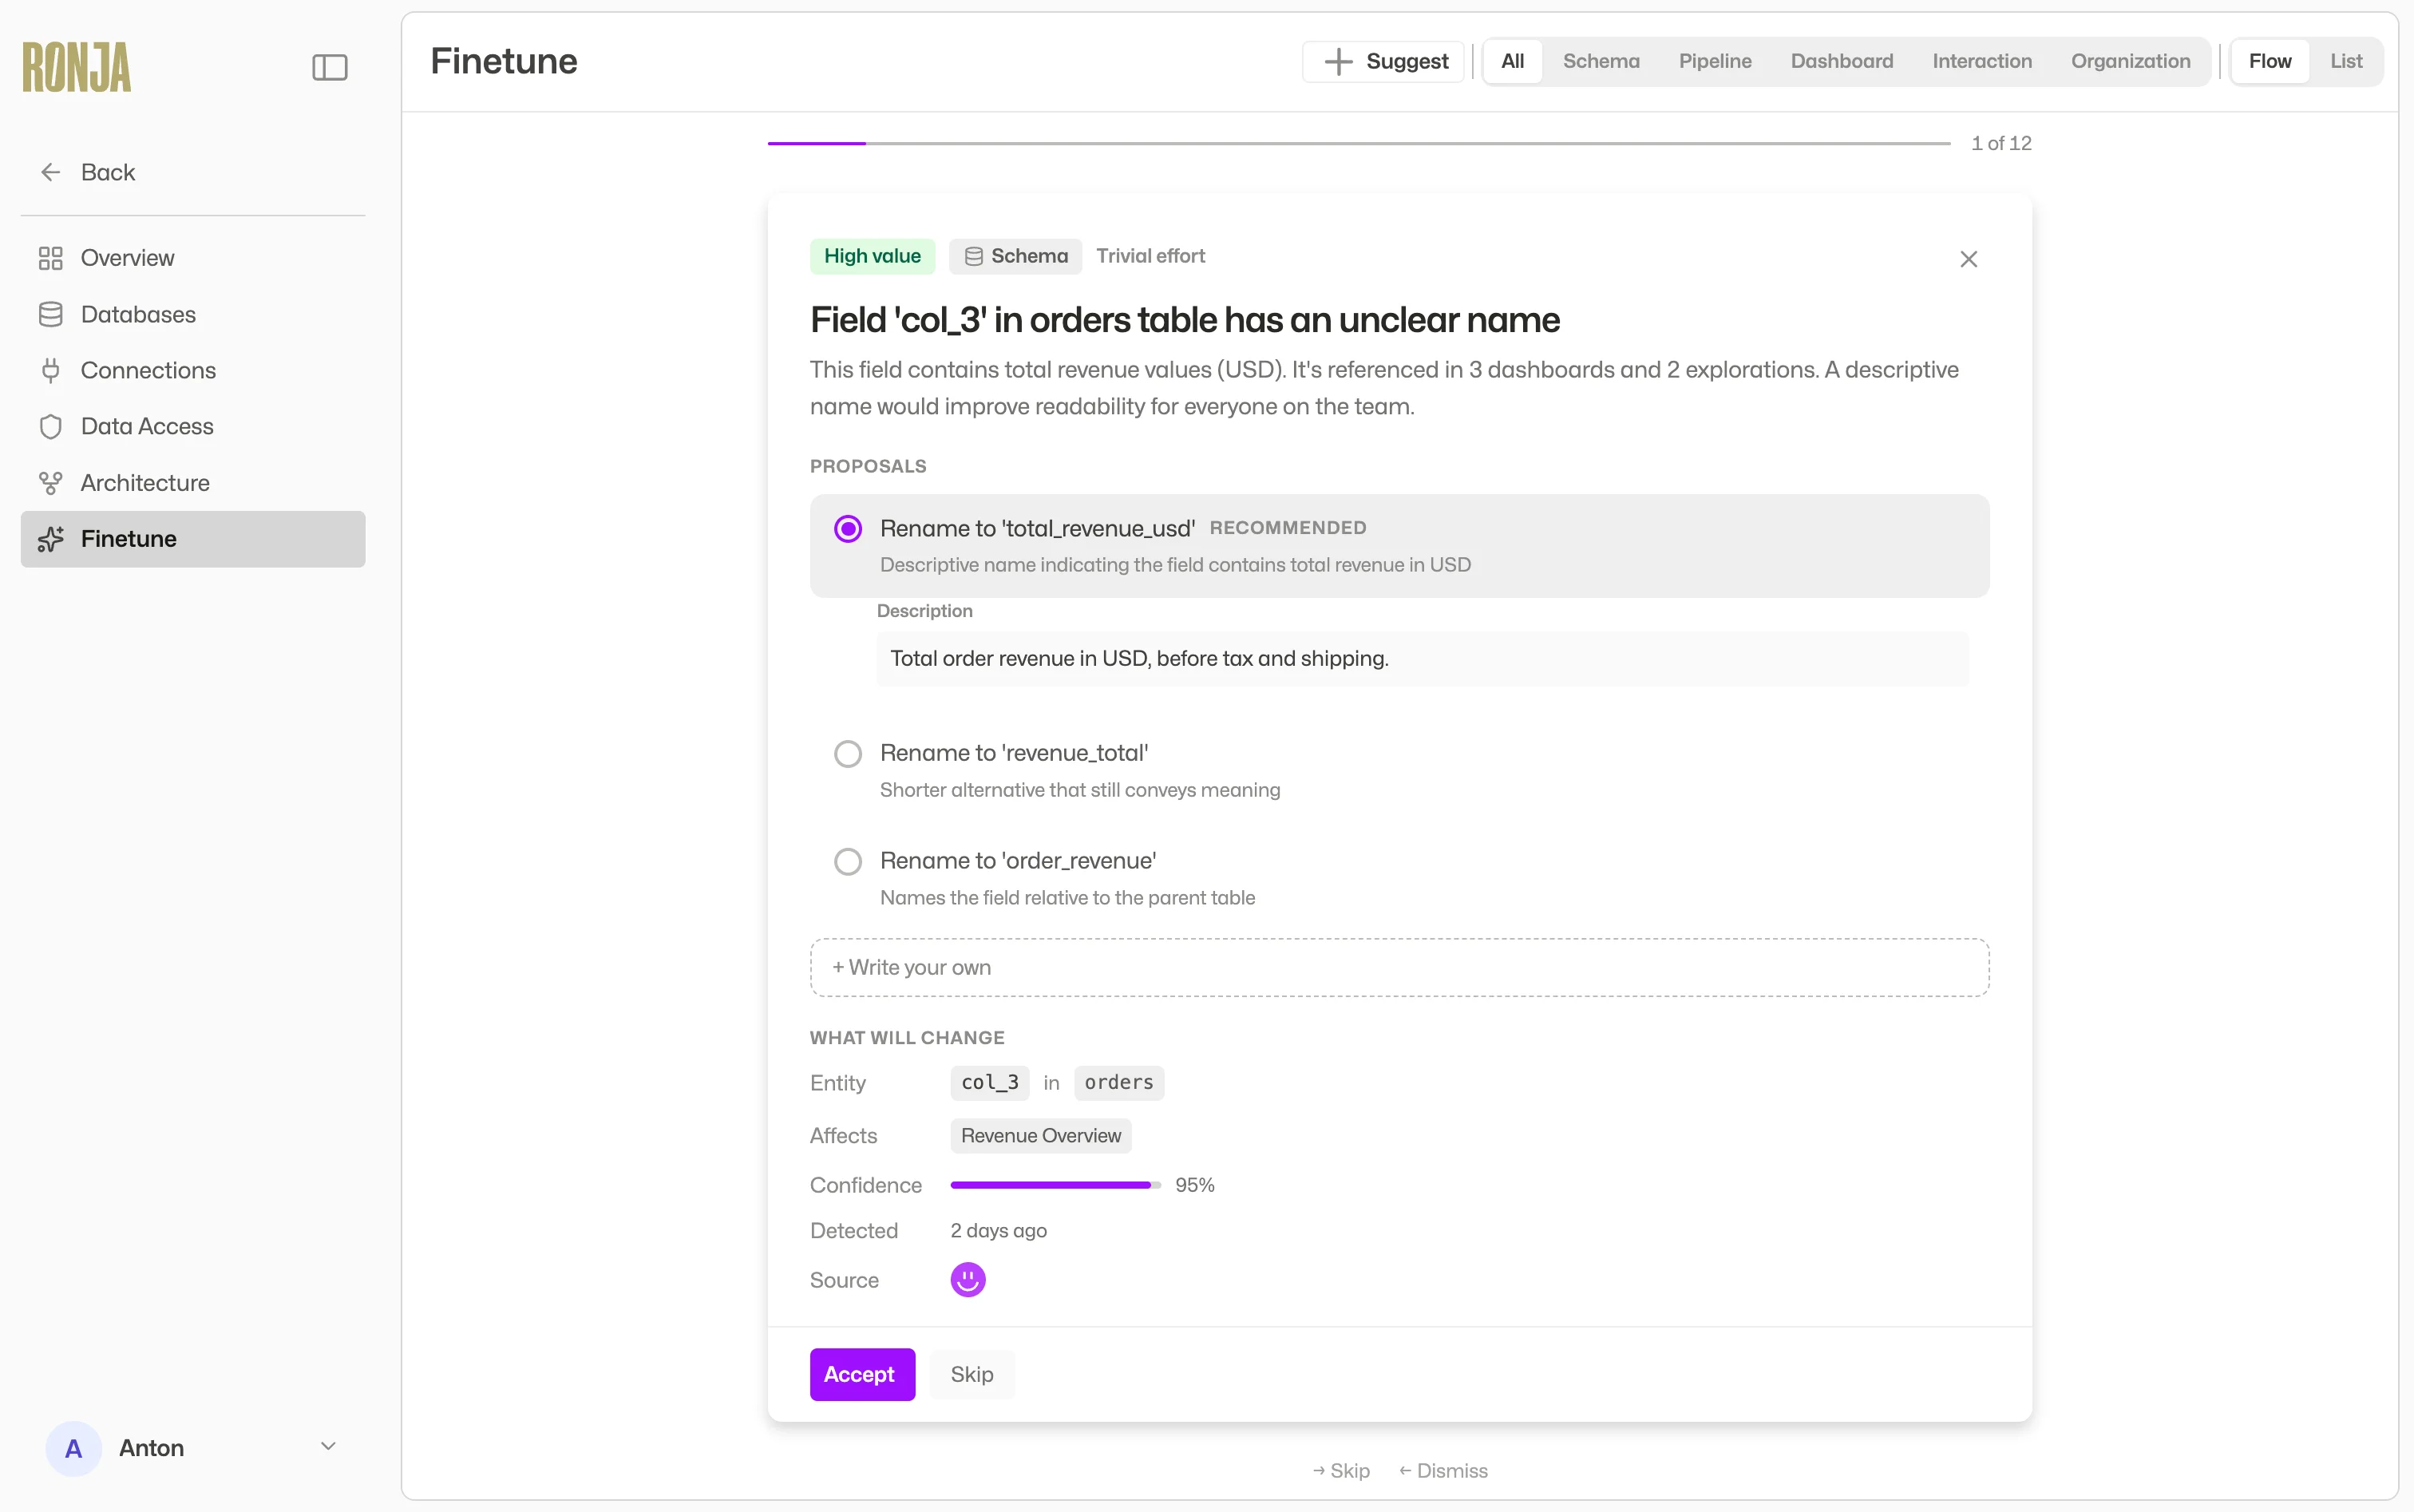
Crap in, quality out
Your data gets better every day.
Agents continuously monitor your data for issues. Missing values, duplicates, inconsistencies. They flag problems and propose fixes for you to approve. Missing definitions for common questions? Ronja notices and helps build context.
Data quality isn't a one-off project. It's something that improves every week, automatically.
Governance & lineage
Every number traceable. Every pipeline governed.
Data lineage
Every table has lineage. Every derived number traces back to source. Click any number to see exactly how it was derived.
Endorsed data sets
Anyone can create data sets. Only users with the right permissions can approve them. The AI always gravitates toward endorsed data sets.
Versioning
All data and transformation code is versioned. Roll back to any point in time. See what changed and when.
Access control
Database-level permissions, workspace controls. Control which data is available to which teams and users.
No black boxes
Agents write real code. Auditable, versioned, reproducible. Nothing is hidden behind a proprietary layer.
Compliance
SOC 2 and ISO 27001 certified. Enterprise-ready from day one.